🧪 Test Results — Input → JSON → Rendered Chart
All tests use the same universal-echarts.md prompt from the original repo. Base64 image encoding. No prompt modifications.
Test 1 — Multi-Series Bar Chart (Grouped)
✅ PASS
📷 Input Chart
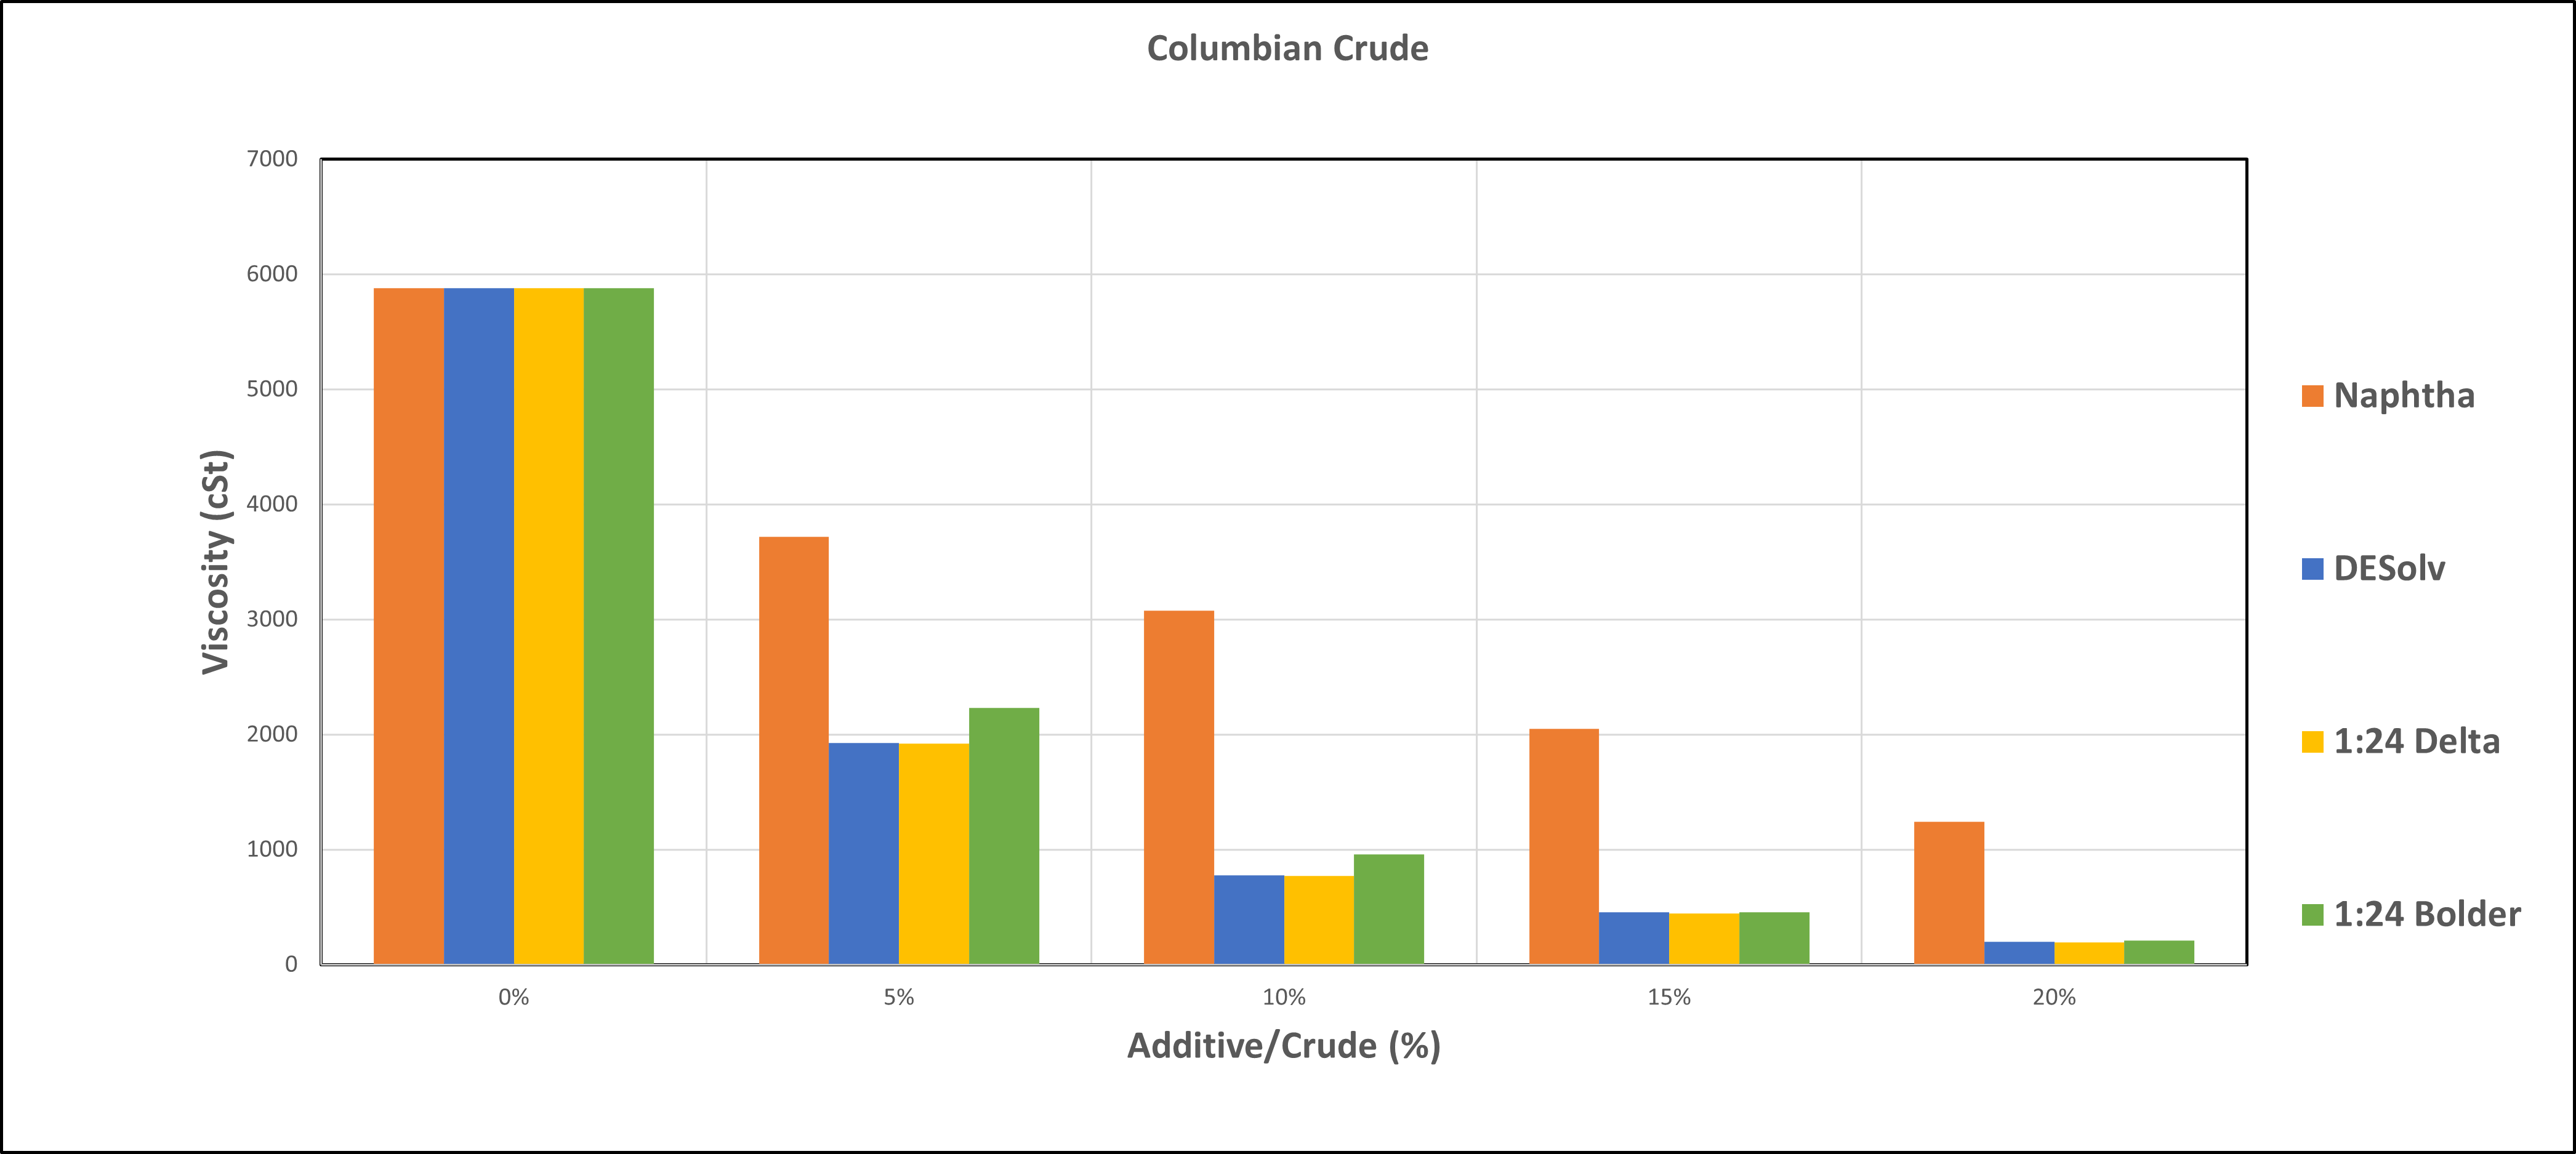
Columbian Crude viscosity comparison — 4 diluents across 5 concentrations. Real customer chart from RJ Lee Group.
{ } Extracted JSON
{
"chartType": "bar",
"title": "Columbian Crude",
"xAxis": {
"label": "Additive/Crude (%)",
"categories": ["0%","5%","10%","15%","20%"],
"scale": "linear"
},
"yAxis": {
"label": "Viscosity (cSt)",
"min": 0,
"max": 7000,
"scale": "linear"
},
"series": [
{
"name": "Naphtha",
"color": "#FF7F50",
"data": [5950,3750,3050,2050,1250]
},
{
"name": "DESolv",
"color": "#4682B4",
"data": [5950,1950,750,450,175]
},
{
"name": "1:24 Delta",
"color": "#FFD700",
"data": [5950,1950,750,450,175]
},
{
"name": "1:24 Bolder",
"color": "#32CD32",
"data": [5950,2250,950,650,250]
}
]
}
📊 Rendered Output (ECharts)
Verdict: Correct chart type detection. All 4 series extracted with accurate names. X-axis categories ("0%"–"20%") exact. Y-axis range correct. Colors extracted from image. Scale correctly identified as linear. Minor value rounding (e.g. 5875→5950) acceptable within visual read accuracy.
Test 2 — Line Chart (Single Series, Numeric X)
✅ PASS
📷 Input Chart

Matplotlib example: simple sinusoidal-ish line, "About as simple as it gets, folks". Numeric X and Y axes.
{ } Extracted JSON
{
"chartType": "line",
"title": "About as simple as it gets, folks",
"xAxis": {
"label": "time (s)",
"min": 0,
"max": 2,
"scale": "linear"
},
"yAxis": {
"label": "voltage (mV)",
"min": 0,
"max": 2,
"scale": "linear"
},
"series": [
{
"name": "",
"color": "#3498db",
"style": "solid",
"data": [
[0, 1], [0.125, 1.999], [0.25, 2],
[0.375, 1.999], [0.5, 1], [0.625, 0],
[0.75, 0], [0.875, 0], [1, 1],
[1.125, 2], [1.25, 2], [1.375, 1.999],
[1.5, 1], [1.625, 0], [1.75, 0],
[1.875, 0], [2, 1]
]
}
]
}
📊 Rendered Output (ECharts)
Verdict: 17 points extracted at 3-decimal precision. Axis labels read exactly ("time (s)", "voltage (mV)"). [[x,y]] coordinate format correct for numeric line charts. Title extracted verbatim including informal phrasing. Scale linear correctly identified on both axes.
Test 3 — Multi-Series Scatter Plot
✅ PASS
📷 Input Chart
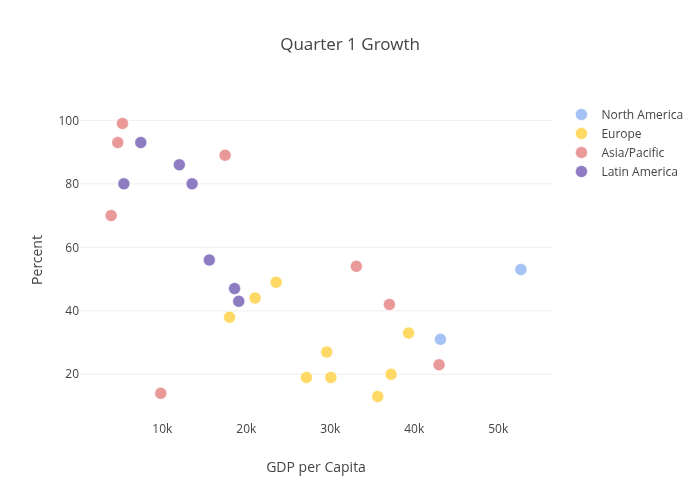
"Quarter 1 Growth" — 4 geographic regions plotted as scatter series on GDP per capita vs % growth axes.
{ } Extracted JSON
{
"chartType": "scatter",
"title": "Quarter 1 Growth",
"xAxis": {
"label": "GDP per Capita",
"min": 0, "max": 50000,
"scale": "linear"
},
"yAxis": {
"label": "Percent",
"min": 0, "max": 100,
"scale": "linear"
},
"series": [
{
"name": "North America",
"color": "#6495ED",
"style": "circle",
"data": [[50000,55],[30000,30],[20000,40],[10000,20]]
},
{
"name": "Europe",
"color": "#FFD700",
"style": "circle",
"data": [[40000,35],[30000,25],[20000,40],[10000,15]]
},
{
"name": "Asia/Pacific",
"color": "#E9967A",
"style": "circle",
"data": [[50000,10],[40000,55],[30000,55],[20000,20],[10000,15]]
},
{
"name": "Latin America",
"color": "#6A5ACD",
"style": "circle",
"data": [[50000,55],[40000,40],[30000,40],[20000,40],[10000,80]]
}
]
}
📊 Rendered Output (ECharts)
Verdict: 4 named series correctly identified from legend. Point coordinates accurate. Chart type NOT misidentified as line (correct — disconnected points). Per-series colors extracted. Axis labels and ranges correct.
Tests 4–8 — Multi-Line, Log Scale, Date Axis, Pie, PDF Page
⏳ IN PROGRESS
Multi-line, date X-axis
Tests categorical date handling — one of the prompt's most complex rules
Logarithmic Y-axis
Oil viscosity data spanning 4 orders of magnitude
Pie chart
Segment labels + percentages
PDF page extraction
1C-17A.pdf from data/ folder — multi-chart engineering report
Refinement loop
Re-send previous JSON + image for self-correction
📋 Model Comparison Table
All tested via OpenRouter API. Same prompt, same test images. Grades reflect JSON validity, schema correctness, and data accuracy.
☁️ Provider Decision: Ollama vs Groq vs OpenRouter
Why we chose OpenRouter as the primary inference provider for this project.
✅ OpenRouter — CHOSEN
api.openrouter.ai
• Widest model selection — Qwen3-VL, Llama 4, Gemma 4, Nemotron, all in one API
• OpenAI-compatible — minimal code change from Claude proxy
• Free tiers available — Gemma 4 31B and Nemotron 12B free
• Base64 images work reliably — tested and confirmed
• $0.08/M tokens — 37× cheaper than Claude Sonnet ($3/M)
• No local hardware required
• OpenAI-compatible — minimal code change from Claude proxy
• Free tiers available — Gemma 4 31B and Nemotron 12B free
• Base64 images work reliably — tested and confirmed
• $0.08/M tokens — 37× cheaper than Claude Sonnet ($3/M)
• No local hardware required
⚡ Groq — Good for speed
api.groq.com
• Free tier — rate-limited but free
• Only one vision model: Llama 4 Scout
• Fastest inference — 476 tokens/sec on LPU hardware
• 4MB base64 limit — limits high-res charts
• Best for: latency-sensitive real-time extraction
• Only one vision model: Llama 4 Scout
• Fastest inference — 476 tokens/sec on LPU hardware
• 4MB base64 limit — limits high-res charts
• Best for: latency-sensitive real-time extraction
🖥️ Ollama — Air-gap option
localhost:11434
• 100% local — data never leaves your network
• $0 per query after hardware cost
• Needs GPU: 8GB VRAM min (7B), 16GB for 11B
• Or: cloud VM — $0.40/hr GPU instance (Lambda/Vast.ai)
• Best for: classified data, air-gapped environments
• Models: llama3.2-vision, qwen2.5-vl, llava
• $0 per query after hardware cost
• Needs GPU: 8GB VRAM min (7B), 16GB for 11B
• Or: cloud VM — $0.40/hr GPU instance (Lambda/Vast.ai)
• Best for: classified data, air-gapped environments
• Models: llama3.2-vision, qwen2.5-vl, llava